Using the Map
The map is the core of Vincenty. It provides real-time situational awareness with location markers, drawing tools, measurement, replay, and GPX support.
Map Overview
Navigate to Map in the top navigation bar.
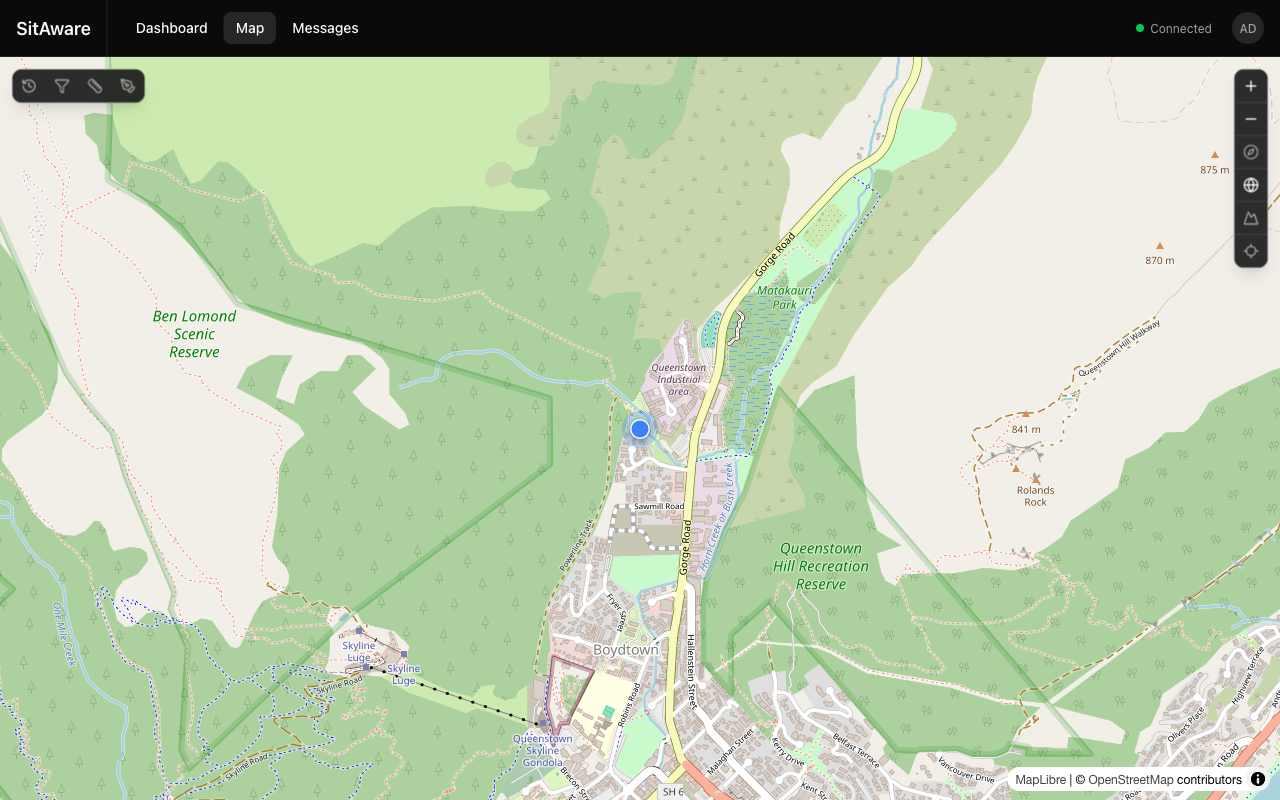
The map displays: - Location markers for all visible group members (updated in real-time) - Your position as a distinct self-marker (blue dot by default) - Map attribution in the bottom-right corner
Map Controls
The right-side toolbar provides these controls:
| Button | Action |
|---|---|
| + / - | Zoom in / out |
| Compass | Reset the map bearing to north |
| Globe | Toggle between flat and globe projection |
| Terrain | Toggle 3D terrain elevation rendering |
| Crosshair | Center the map on your current location |
Left Toolbar
The left-side toolbar provides access to advanced map features:
| Button | Description |
|---|---|
| Replay | Open the location history replay panel |
| Filters | Show/hide specific users or groups on the map |
| Measure | Open the measurement tool |
| Draw | Open the drawing tool |
Drawing on the Map
Click the Draw button to open the drawing panel.
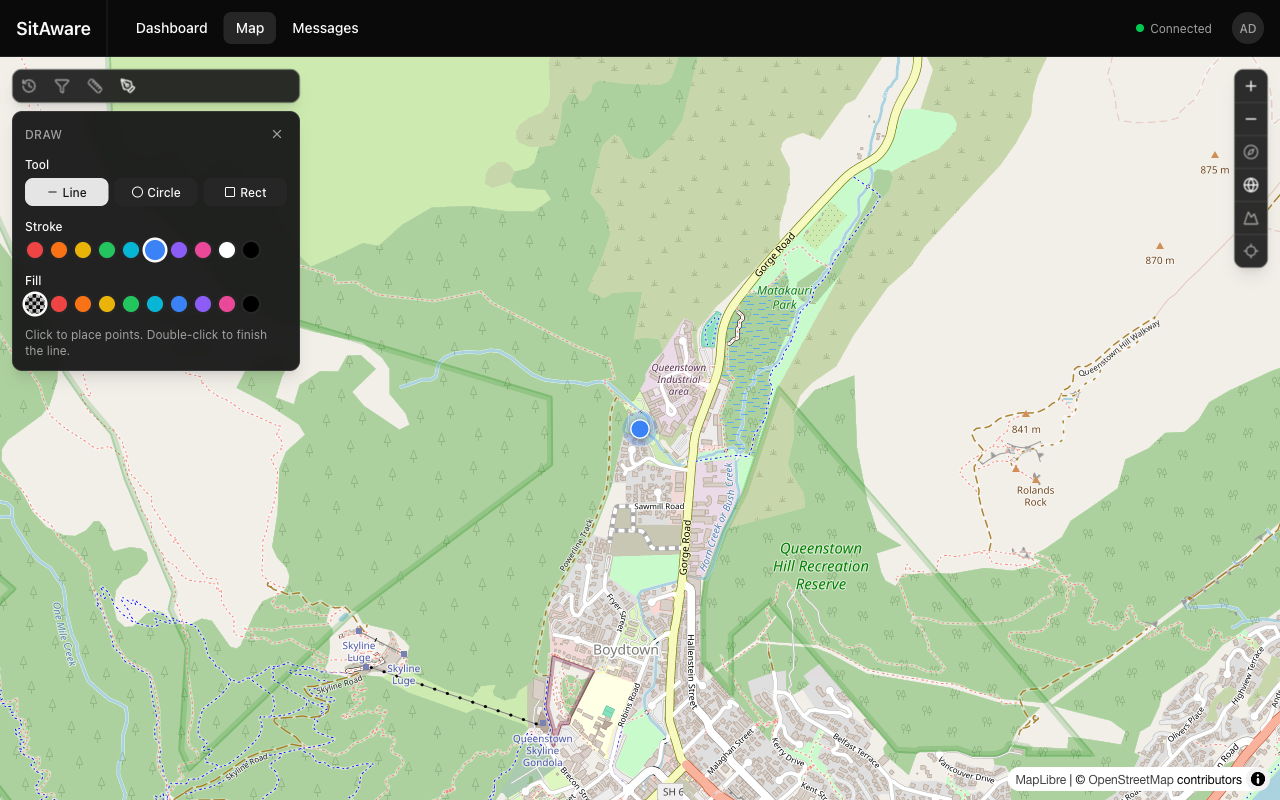
Drawing Modes
| Tool | How to Use |
|---|---|
| Line | Click to place points. Double-click to finish the line. |
| Circle | Click to set the center, then click again to set the radius. |
| Rect | Click to set one corner, then click to set the opposite corner. |
Styling
- Stroke -- choose from 10 color presets (red, orange, yellow, green, cyan, blue, purple, pink, white, black)
- Fill -- choose a fill color or select "No fill" for outlines only
Saving and Sharing
Drawings are automatically saved to the server as GeoJSON. They can be shared with your group members, who will see them rendered as overlays on their maps.
Measuring Distances
Click the Measure button to open the measurement panel.
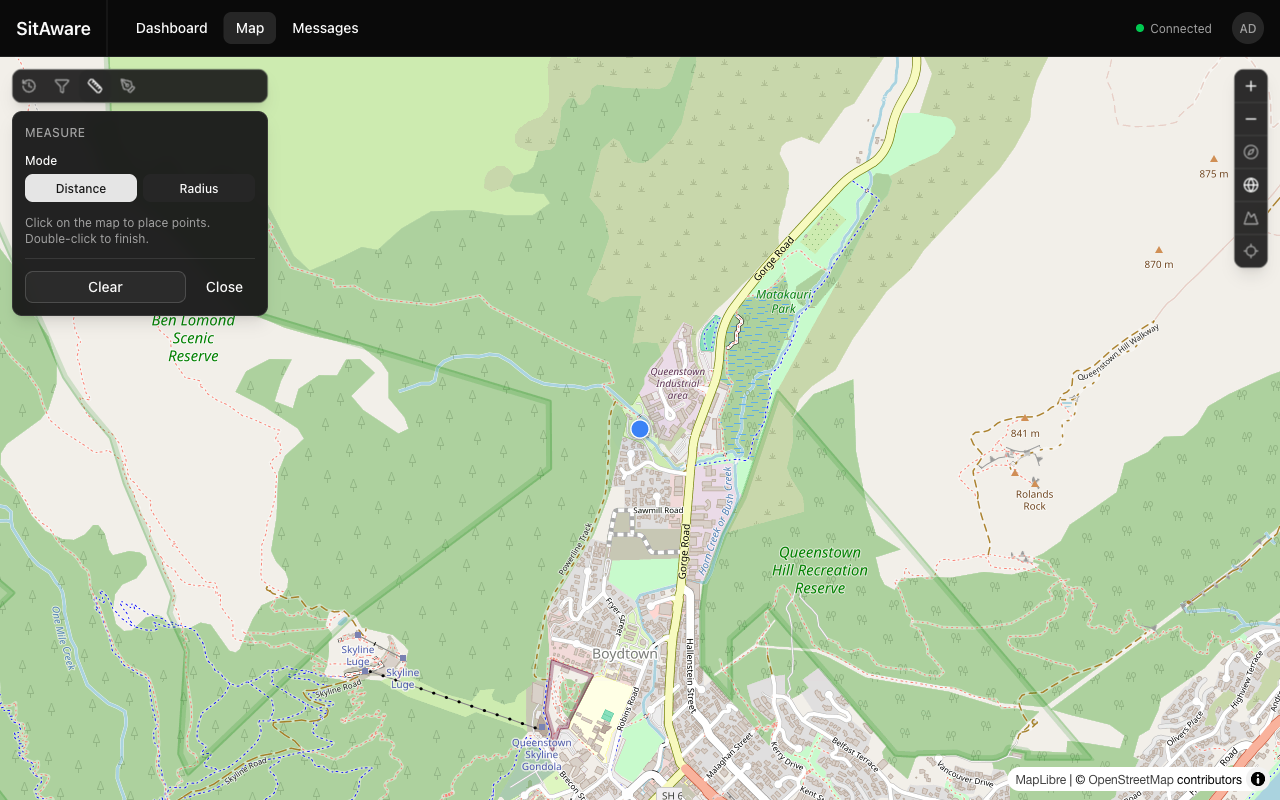
Measurement Modes
| Mode | How to Use |
|---|---|
| Distance | Click points on the map to create a path. The total distance is displayed. Double-click to finish. |
| Radius | Click a center point, then click to set the radius. The radius distance is displayed. |
Click Clear to remove all measurements, or Close to exit the tool.
Replaying Location History
Click the Replay button to open the replay panel.
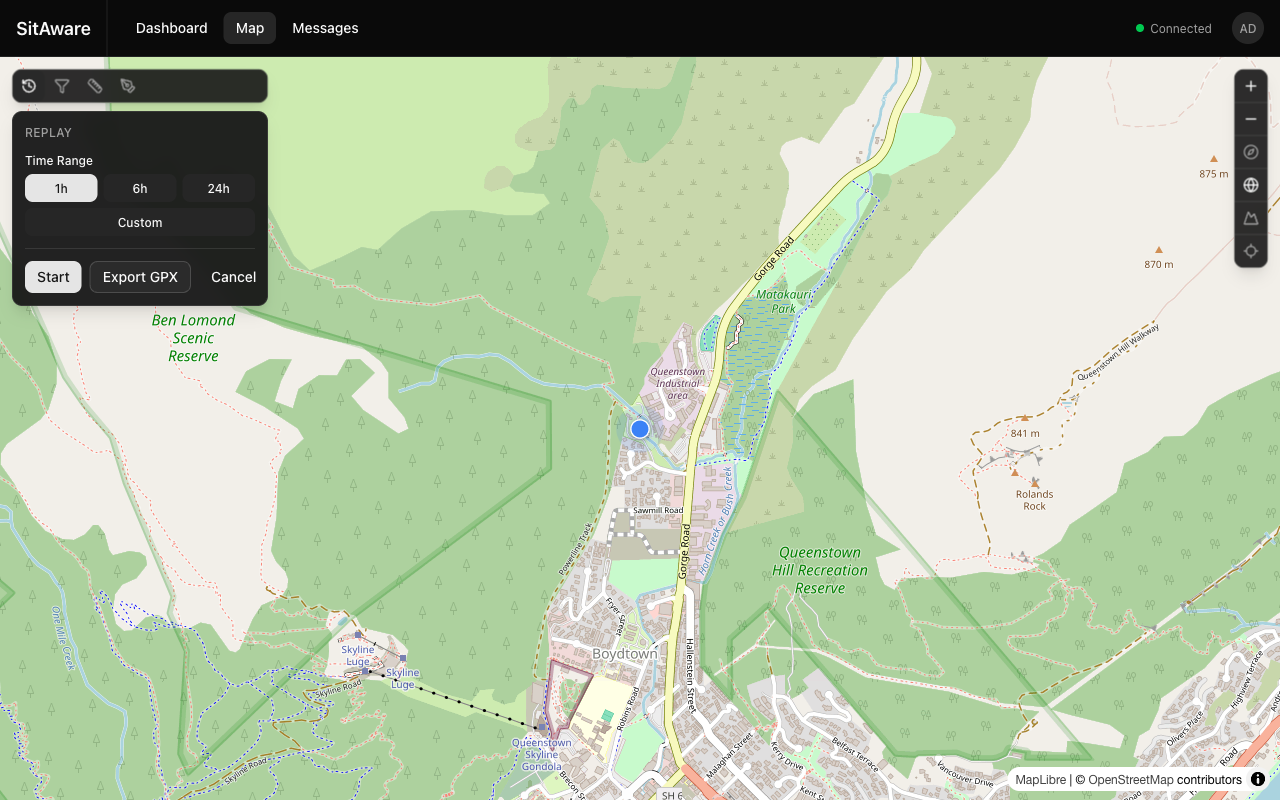
How to Replay
- Select a Time Range -- choose from quick presets (1h, 6h, 24h) or click Custom to set a specific date/time range.
- Click Start to begin playback. Location tracks will be rendered on the map showing the movement paths.
- Use the playback controls to pause, resume, or scrub through the timeline.
Exporting GPX
Click Export GPX to download the location history for the selected time range as a GPX file. This can be opened in mapping applications like Google Earth, QGIS, or other GPS tools.
GPX Overlays
When a GPX file is sent as a message attachment, it is automatically parsed and can be rendered on the map. GPX tracks, routes, and waypoints appear as overlays.
Filtering Map Content
Click the Filters button to control what is visible on the map: - Show/hide specific users' markers - Show/hide specific group overlays - Toggle drawing and track overlays
Location Markers
Each user's position is shown as a marker with their username label. Marker appearance is customizable: - Shape -- circle, square, triangle, diamond, star, crosshair, pentagon, hexagon, arrow, or plus - Color -- 10 presets or custom hex color
Users customize their own marker in Account Settings > General. Group admins can set a default marker style for the group.
Terrain and 3D View
Click the Terrain toggle to enable 3D terrain rendering. The map will display elevation data, giving a sense of the physical landscape. Click the Globe toggle to switch to a 3D globe projection.
Terrain sources are managed by administrators in Server Settings > Map.